The Time Trend Compare Widget is a special tool for visualization of time series trends compared with different time interval of the same time series. If the intention is to compare different time series the instrument is the Multi Time Series, also called Multie Series. A tool for visual Analytics, Comparing
- 4 hours wrt those before, or same hours of previous day
- 12 hours wrt those before, or same hours of previous day
- Day wrt day before, or same day of previous week or month
- Week wrt to previous week, or week starting on Monday
- Month wrt to previous month, or previous month starting 1st day, or same month of the previous year
- 6 Months wrt to previous 6 months, or Aligned day 1 or same 6 months previous year day 1 or 6 months previous year day 1 aligned 1st or 2nd semester
- Year wrt to previous year, or previous year starting 1st day, or previous year starting same month

The widgets represent in cyan the actual trend of different values compared with the trend of the last period in grey.
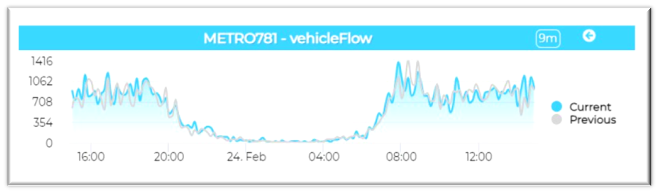
"Next" and "Prev" buttons can be used to display values to different date and times.
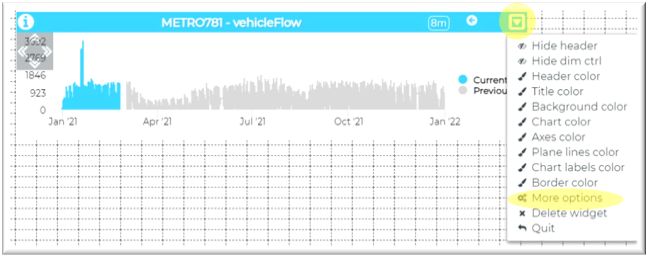
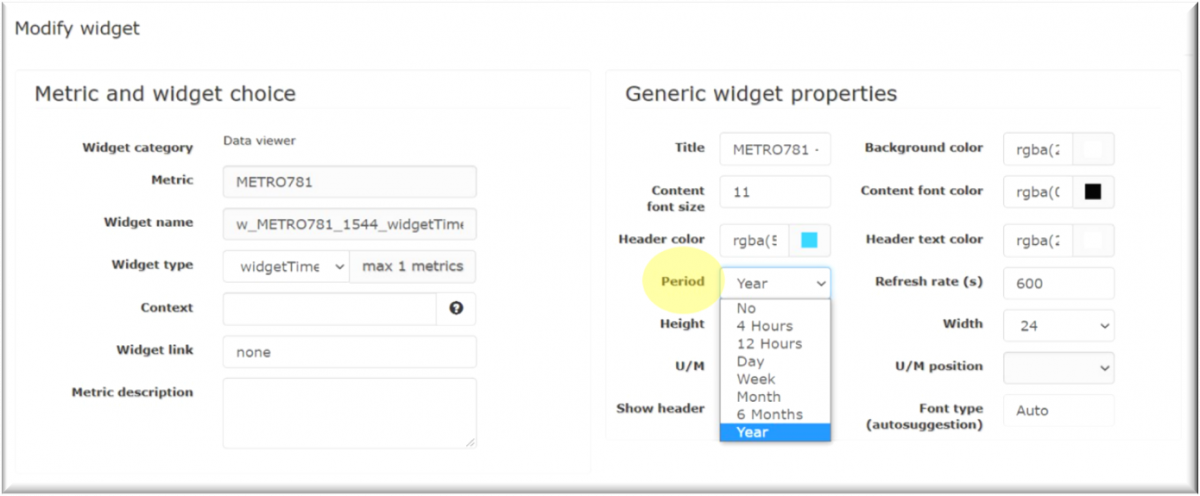
The period showed in the widget can cover different periods of time. By clicking the More option item in the contextual menu of the widget, in the Generic widget properties box, is possible to change a Period of time.
In particular, the Period dropdown menu is available for specific widget types that represent values showed in a period of time:
- 4 Hours
- 12 Hours
- Day
- Week
- Month
- 6 Months
- Year
The actual period can be compared with different previous period (compare period) and the possible choices vary according to the chosen Period in the Period dropdown menu.

In the Specific widget properties box it is possible to specify the Compare Period, according to the selected period:
- 4 Hours
- 4 previous hours: the actual trend is compared with the trend of the 4 previous hours.
- 4 hours day before: the actual trend is compared with the same 4 hours of previous day.
- 12 Hours
- 12 previous hours: the actual trend is compared with the trend of the 12 previous hours.
- 12 hours day before: the actual trend is compared with the same 12 hours of previous day.
- Day
- previous day: the actual trend is compared with the trend of the previous day.
- same day previous week: the actual trend is compared with the same day of the previous week.
- same day previous month: the actual trend is compared with the same day of the previous month.
- Week
- previous week: the actual trend is compared with the previous week.
- previous week starting Monday: the actual trend is compared with the previous week, both starting from Monday.
- Month
- previous month: the actual trend is compared with the previous month.
- previous month – day 1: the actual trend is compared with the previous month, both starting from the first of month.
- previous month prev year – day 1: the actual trend is compared with the same month of previous year, both starting from the first of month.
- 6 Months
- previous 6 months: the actual trend is compared with the previous six months.
- previous 6 months – day 1 of prev 6 months: the actual trend is compared with the previous six months, both starting from the first day of the first month of semester.
- same 6 months of prev year – day 1: the actual trend is compared with the same six months, both starting from the first day of the first month of semester.
- same 6 months of prev year – day 1 month 1 or 7: the actual trend is compared with the same six months, both starting from the first day of January or July, depending of the semester.
- Year
- previous year: the actual trend is compared with the previous year.
- previous year – day 1 of prev year: the actual trend is compared with the previous year, starting from the first day of previous 12 months.
- previous year – month 1: the actual trend is compared with the previous year, starting from the first of January.
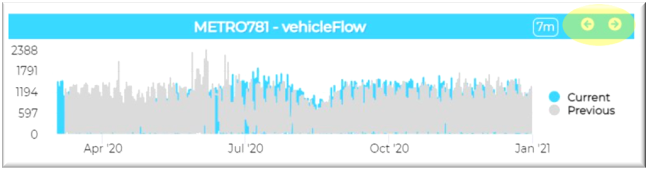
The final result will be something similar to the image below. By clicking the left/right arrows the data will be shown in the next/previous period of time.
