
Snap4City provides a generic tool to access and exploit Copernicus Satellite data https://www.copernicus.eu/en/copernicus-satellite-data-access from IOT App and on Dashboards, see for example:
https://www.snap4city.org/dashboardSmartCity/view/index.php?iddasboard=MzAwNQ==
This tools allows to process Sentinel's satellite from European Union's Earth Observation Programme Copernicus and to create corresponding heatmaps as shown in the example above, simplifying all the process of search and analysis of complex satellite data.
Different data from Copernicus Sentinel satellites can be exploited by using Snap4City. Some of them can be processed authomaticcaly by using the interface as described below. Others are available under request.
- SENTINEL-1 is an imaging radar mission providing continuous all-weather, day-and-night imagery at C-band. The SENTINEL-1 constellation provides high reliability, improved revisit time, geographical coverage and rapid data dissemination to support operational applications in the priority areas of marine monitoring, land monitoring and emergency services.
- SENTINEL-2 is a wide-swath, high-resolution, multi-spectral imaging mission, supporting Copernicus Land Monitoring studies, including the monitoring of vegetation, soil and water cover, as well as observation of inland waterways and coastal areas.
- The main objective of the SENTINEL-3 mission is to measure sea surface topography, sea and land surface temperature, and ocean and land surface colour with high accuracy and reliability to support ocean forecasting systems, environmental monitoring and climate monitoring. The main instruments of the Sentinel-3 mission are: Ocean and Land Colour Instrument (OLCI), Sea and Land Surface Temperature Radiometer (SLSTR), SAR Radar Altimeter (SRAL), MicroWave Radiometer (MWR) and Precise Orbit Determination (POD) instruments.
- SENTINEL-5P TROPOMI covers three environmental themes related to Air Quality: Stratospheric Ozone Layer and Climate Change Monitoring and Forecasting.
Snap4City exploits Copernicus Data provided by SENTINEL-3 and SENTINEL-5P satellites. The following table summarizes the list of data that can be exploited in Snap4City. Data in bold green are operative and can be processed automatically as described below. The others can be processed under request.
variable |
units |
long_name |
mission |
instrument_name |
| atmospheric_temperature_profile | K | Air temperature profile | Sentinel-3 | OLCI |
| humidity | % | Relative humidity | Sentinel-3 | OLCI |
| OGVI | OLCI Global Vegetation Index | Sentinel-3 | OLCI | |
| temperature_tx | K | 2m air temperature | Sentinel-3 | SLSTR |
| nitrogendioxide_tropospheric_column | mol m-2 | Tropospheric vertical column of nitrogen dioxide | Sentinel-5P | TROPOMI |
| ozone_total_vertical_column | mol m-2 | total ozone column | Sentinel-5P | TROPOMI |
| carbonmonoxide_total_column | mol m-2 | Vertically integrated CO column | Sentinel-5P | TROPOMI |
| sulfurdioxide_total_vertical_column | mol m-2 | total vertical column of sulfur dioxide for the polluted scenario derived from the total slant column | Sentinel-5P | TROPOMI |
| cloud_fraction | effective radiometric cloud fraction | Sentinel-5P | TROPOMI | |
| horizontal_wind | m.s-1 | Horizontal wind vector at 10m altitude | Sentinel-3 | OLCI |
| reference_pressure_level | hPa | Reference pressure level | Sentinel-3 | OLCI |
| sea_level_pressure | hPa | Mean sea level pressure | Sentinel-3 | OLCI |
| total_columnar_water_vapour | kg.m-2 | Total column water vapour | Sentinel-3 | OLCI |
| total_ozone | kg.m-2 | Total columnar ozone | Sentinel-3 | OLCI |
| IWV | kg.m-2 | Integrated water vapour column above the current pixel | Sentinel-3 | OLCI |
| OTCI | OLCI Terrestrial Chlorophyll Index | Sentinel-3 | OLCI | |
| dew_point_tx | K | 2m dew point | Sentinel-3 | SLSTR |
| east_west_stress_tx | N m-2 s | East-west integrated surface wind stress | Sentinel-3 | SLSTR |
| latent_heat_tx | W m-2 s | Integrated surface latent heat flux | Sentinel-3 | SLSTR |
| north_south_stress_tx | N m-2 s | North-south integrated surface wind stress | Sentinel-3 | SLSTR |
| sea_ice_fraction_tx | Sea ice fraction | Sentinel-3 | SLSTR | |
| sea_surface_temperature_tx | K | Sea surface temperature | Sentinel-3 | SLSTR |
| sensible_heat_tx | W m-2 s | Integrated surface sensible heat flux | Sentinel-3 | SLSTR |
| skin_temperature_tx | K | Skin temperature | Sentinel-3 | SLSTR |
| snow_albedo_tx | Snow albedo | Sentinel-3 | SLSTR | |
| snow_depth_tx | metre | Snow liquid water equivalent depth | Sentinel-3 | SLSTR |
| soil_wetness_tx | m | Volumetric Soil Water Layer 1 | Sentinel-3 | SLSTR |
| solar_radiation_tx | W m-2 s | Integrated surface solar radiation | Sentinel-3 | SLSTR |
| surface_pressure_tx | hPa | Surface pressure | Sentinel-3 | SLSTR |
| temperature_profile_tx | K | Atmospheric temperature profile | Sentinel-3 | SLSTR |
| thermal_radiation_tx | W m-2 s | Integrated surface solar radiation | Sentinel-3 | SLSTR |
| total_column_ozone_tx | kg m-2 | Total column ozone | Sentinel-3 | SLSTR |
| total_column_water_vapour_tx | kg m-2 | Total column water vapour | Sentinel-3 | SLSTR |
| aerosol_index_354_388 | 1 | Aerosol index from 388 and 354 nm | Sentinel-5P | TROPOMI |
| aerosol_index_340_380 | 1 | Aerosol index from 380 and 340 nm | Sentinel-5P | TROPOMI |
| formaldehyde_tropospheric_vertical_column | mol m-2 | vertical column of formaldehyde | Sentinel-5P | TROPOMI |
| aerosol_mid_pressure | Pa | air_pressure_at_center_of_aerosol_layer | Sentinel-5P | TROPOMI |
| aerosol_mid_height | m | Height at center of aerosol layer relative to geoid | Sentinel-5P | TROPOMI |
| cloud_top_pressure | Pa | cloud optical centroid top pressure | Sentinel-5P | TROPOMI |
| cloud_base_pressure | Pa | cloud base pressure assumed in ROCINN retrieval | Sentinel-5P | TROPOMI |
| cloud_top_height | m | cloud top height | Sentinel-5P | TROPOMI |
| cloud_base_height | m | cloud base height assumed in ROCINN retrieval | Sentinel-5P | TROPOMI |
How to exploit satellite operative data in Snap4city
The access to this tool is available only for an Area Manager user. https://iot-app.snap4city.org/nodered/nr6f5m6/copernicus
To exploit the tool it is necessary to request the authorization to access the tool by sending an email to snap4city@disit.org

From top to bottom the following info have to be inserted:
- Map name: a name to be assigned to the heatmap. It is possible to specify yet existing heatmaps to be updated;
- Metric name: select the interested metric from the list. the following metrics are available to be exploited authomatically from satellite data: Air Temperature, Humidity, Altitude, Vegetation Index (OGVI), Cloud Fraction, SO2, O3, NO2, CO
- Description: a generic description;
- Location: select at which level the heatmap has to be created. It is possible to specify one of the following: City, Country, State and Postal Code;
- Location Name: specify here the location. It can be, for example, the name of a City or "Città Metropolitana di Firenze", or "Toscana" as State or "Italy" as Country, etc.;
- Color Map: from the drop down list, select the corresponding color map to be used for the heatmap visualization;
- Org: from the drop down list, select the organization in Snap4City to be assigned for the heatmap;
- From Date - To Date: use these forms to specify the time period of the data to be downloaded. Please note that typically satellite data are updated 1 time per day. If a longer period is specified, all data included in the period will be downloaded and, according to the available data, more heatmaps will be generated covering the specified time period;
- Length: specify here the dimension in meters of the geographical cluster, for example 700;
- Write: select to write (1) or not (0) to database the data crawled/processed from Sci-Hub. Value (1) is useful to add the possibility to click in any point in the map and see the corresponding value.
Click Submit button to start the process. In the "Result:" the created token will be shown allowing you to check the process status.
To check the process status go to the following page: https://iot-app.snap4city.org/nodered/nr6f5m6/token

Copy the token in the "Token" form, copy the password and click Submit to check the status. The following results can be shown:
- completed: 0 = not completed), 1 = completed, -3 = no data found
- indexed: 1 = indexed, 0 = not indexed
The access to this service is also possible by using microservices via an IOTApp.
To this aim, you have to import the microservices in your IOTApp flow:
1. open an IOTApp and on the top right menu icon, select Import

2. Click on the "S4C Nodes" tab and select the Sci-Hub microservices to be imported. Click the Import button to confim. You have to import one microservice node at a time;

3. You will find the new Sci-Hub microservices in the node list on the left;

4. Now you can use Sci-Hub microservices to build your flow and to create your heatmap, as shown in the following example:
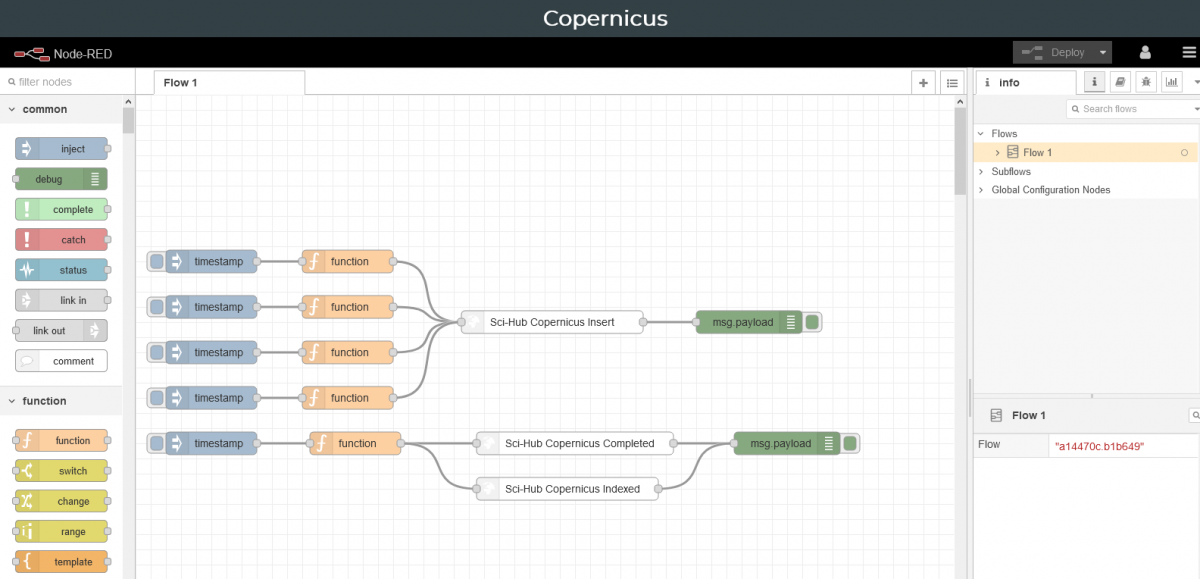
[...TO BE COMPLETED...]